How to choose a right cooling & ventilation solution
Normally, most users select cooling and ventilation solutions by referring to maximum flow rate, maximum static pressure and fan speed data in product specification. Y.S. TECH highly recommends you to focus on the operating point in your cooling/ventilation module performance curve profile, do not only refer the maximum point or fan speed. Meanwhile, a cooling/ventilation requirement should not only reference the flow rate or static pressure, but two key factors of power consumption and acoustic noise. However, these critical factors have trade-offs. We use cooling fan as a case to illustrate some methods of how to select a solution in the following content.
Step1Ask five questions before choosing a fan
Here are five questions of thermal inquiry we need to verify at first. That include:
1.Watt:How many watts would you need to dissipate?
2.Air Impedance:What is your system air-impedance?
3.Noise:What is acoustic noise specification you need?
4.Temperature Gradient:What is your design of ΔT?
5.Dimension:What is fan dimension you need?
Step2Choose a right fan & blower to meet your thermal inquiry
The effects of heat transfer include Conduction, Convection and Radiation. Most heat transfer by conduction and radiation effects that concern about system mechanism. For example, a good chassis or heatsink design is more helpful for thermal solutions. Convection effects contain free convection and forced convection. Cooling fan and blower are the major effect for force convection and always increase entire thermal solutions more efficient. Illustration 1 shows you a normal system of heat dissipation status. Pcon&rad presents heat dissipation on free convection and Radiation transfer. Psys presents total power consumption of system. Pfan presents forced convection that need cooling fan or blower to dissipate. ΔT presents Temperature Gradient ΔT = T2 - T1, T2 is the thermal spec of critical parts with margin tolerance. T1 presents Ambient Temperature.
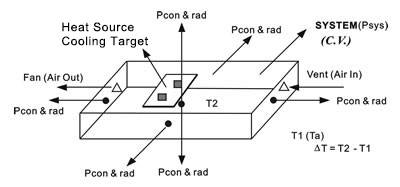
Illustration 1: System Heat transferred
Then we can estimate Flow Rate inquiry by followed equations
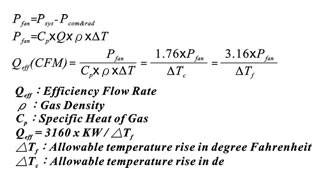
By incorporating conversion factors, specific heat and density of sea level air we can summarize above equations as Qeff that called effective flow rate. Qeff ask fan’s operating point need to be met. In another words, Fan Operating Point should over or equal to Qeff. Fan Operating Point is an intersection point by fan performance curve (flow rate/ static pressure) and system air impedance curve. It’s caused by different system or components placement and form factors. Normally, It is measured by static pressure, △Pi . Its formula may show as below:
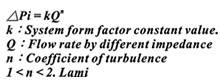
Illustration 2 shows two fans performance curve and system air impedance curve. Even B’s maximum flow rate is higher than A’s but the Qop_A better than Qop_B. Both Qop_A and Qop_B are Operating Points.
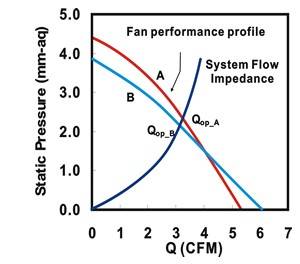
Illustration 2: Fan Performance Comparison
If Qop_B < Qeff < Qop_A, Then we can say Fan A is a proper choice for this thermal solution. So that why we emphasize that focus on fan performance profile rather than on maximum flow rate or static pressure or rotational speed.
Step3Choose a solution with Low Noise
As aforementioned, the flow rate, static pressure and acoustic noise are always trade-off. It is very difficult to think over these factors at the same time. Meanwhile, a lot of troubles are caused by improper applications too. For example, fan mounted to chassis improperly may cause vibration and flow disturbance, and then got higher acoustic noise. Here are some key points regarding to low noise design for your reference:
1.A proper system air impedance design Higher system air impedance needs a higher static pressure fan, but It accompanies with higher noise. Give an enough space to your critical parts and place them at flow path as possible. But it is a tough work to get space for thermal solutions in a slim and light. However, we recommend you to measure you system air impedance and collect enough parameters to know your △Pi. Normally, most specialized fan manufactures will support you to measure it by Air Chamber.
2.Choose a proper fan that base on Qeff We have illustrated you a method to figure out a right fan for Qeff, and then you should consider about power consumption and acoustic noise. Which one is the first priority? To evaluate these two parameters under the same Qeff base is Y.S. TECH’s recommendations.
3.Review a fit mechanism design between fan and application system Vibration and Flow Disturbance always cause resonance and get higher acoustic noise. A proper fan mounting and flow field design may decrease acoustic noise. For example, mounting with a rubber cap on high-speed fan model will decrease vibration resonance. Review your design to make sure there is enough margin space (over 1.5mm) at flow inlet/outlet side and no any stuff to disturb flow filed.

Advance fan speed control by your thermal profile
( Hardware & Software, LIN/CAN BUS support)
Thermal profile is similar to fan performance profile. Normally, different functions will need to dissipate different power consumption. Then we can modulate fan rpm and ask fan to operate on a proper rpm by different system function. The most popular advanced fan speed controls are PWM control (Pulse Width Modulation), Thermostat control (NTC, thermistor) and a combination of both of them.
Sound Quality analysis
In the past we have always focused on Sound Pressure only, but that is not sufficient for us any longer. Legal regulations have led to a reduction of noise limits, but people still have issue with the sound quality of the noise. A sole reduction of noise levels is not sufficient to reduce the annoyance due to the pitch of the sound noticeable by human beings. This is because the subjective human aural perception is often disregarded. However, the judgment of a sound event involves a wide range of different parameters forming into the total hearing impression. So we are not only concern about sound pressure but also 「Sound Quality」
The examination methods are based on the idea of correct recording and describing the noise exposure from the acoustic environment in a way that reflects what humans subjectively perceive. To record this entire perception, physical aspects as well as psychoacoustic characteristics of hearing and cognitive aspects must be considered. The focus of psychoacoustics is the subjective aural perception by human beings. The goal is objectively describing this subjective perception. Psychoacoustic measuring methods account for the actual hearing impression, as opposed to conventional measuring methods that only record the sound level in the form of the equivalent continuous sound level.
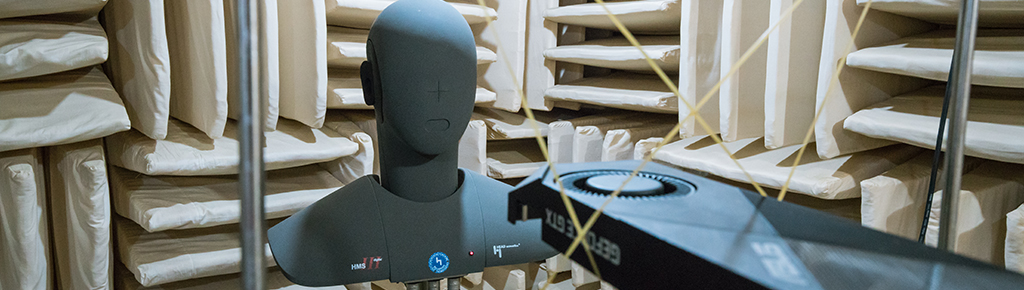
Y.S. TECH introduced the「Sound Quality Analysis System」of HEAD ACOUSTIC in German. Those include an Artificial Head and analysis tool and also the most popular measuring and analysis system in automotive industry. Its parameters are include「SPL, sound pressure level」、「Tonality」、「Sone」and「Modulation」.
The measuring method and standards are as below:
1.ANECHOIC Room Noise Measurement System.
2.Digital Head Measurement System, 16-bits version.
3.SQlab III, Mobile Multi-channel Analysis System.
4.Specifications:ISO 3744, ISO 3745, ISO 7779,CNS 6753, JIS 8346
5.Background Noise: < 17dB(A)

MTTF Methodology ( L10)
Fan reliability can be evaluated in several ways. The data for a life test can be plotted as a cumulative distribution that shows the total fraction of fans failing up to any operating time. Fig. 1 is a sample of cumulative distribution, which was stopped at 8,400 hours after 18 out of 48 fans had failed.
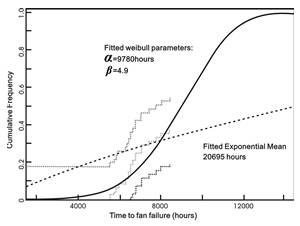
Figure 1:Sample cumulative distribution function, Weibull vs.
Empirical with 95% confidence bands
(Reference:IBM Corp. , May 1996, Vol.2, No.2, Electronics Cooling)
Some vendors provide life expectancy data to customers based on the exponential assumption. However, life test data does not support the use of the exponential distribution. Nevertheless the past experimentation fitting has shown that the Weibull distribution provides a good fit to real fan life data. The Cumulative Distribution Function ,F(t) of Weibull distribution is a below:
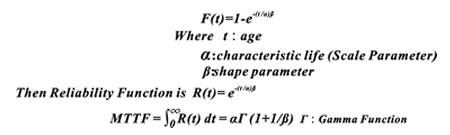
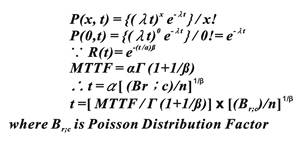
Normally, L10 was introduced a life expectancy parameters by fan vendors. That means the tenth percentiles under an assumed life distribution such as the Weibull. Sometimes vendors will also quote the Mean Time To Failure (MTTF) then we need to figure out the correlation between L10 and MTTF by following equations:
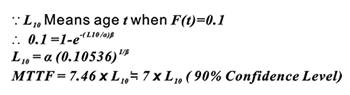
After we have verified the correlation between L10 and MTTF, we also need to know how long should a sample size be tested to determine with 90% confidence level that L10 greater than or equal to expectancy value at a test temperature without failure (x = 0). Here we introduce the Poisson Distribution to estimate.
Normally on the condition of 90% confidence level and 0 failure then Br;c = 2.303. Then we introduce Takes Martin Marietta Model to estimate Life at different environment stress.
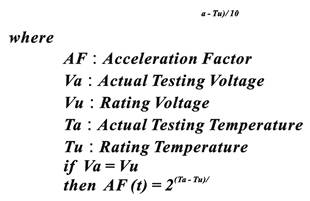
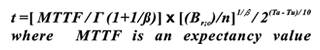
Then we can define the Required Test Time (t) with zero failure is as below:

Green Product & Substance Management
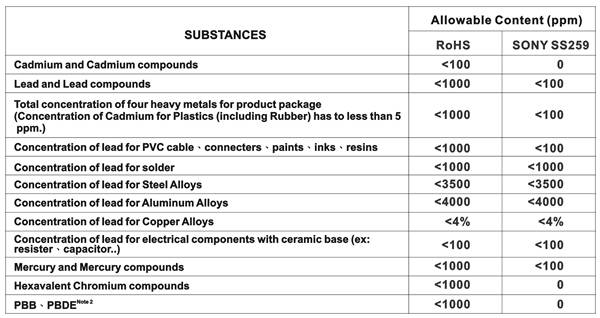
●Management Standards
Note:
1. Yen Sun Technology Corporation (Y.S. TECH) guarantees that all products we produce involved with all spare parts, materials, packing materials, manufacturing process and additives in the manufacturing process are fully comply with the requirements of Directive 2011/65/EU (RoHS 2.0) and 2015/863/EU.
●Standards for Preconditioning and Measurement
I.Pre-conditioning
1. Cd/Pb/Hg:
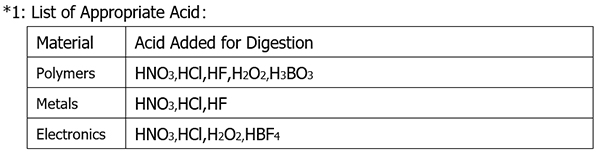
1.1 For different material,digest the sample with appropriate acid
1.2 Confirm the tested samples are totally dissolved.
1.3 Make up with deionized water.
1.4 Analyzed by ICP-OES.
2. Cr6+:
2.1 Metal:
2.1.1 50cm2 sample, boiling water extraction.
2.1.2 Cool and filter the extract.
2.1.3 Make up with deionized water and add diphenylcarbazide solution.
2.1.4 Visual observation
2.1.5 Analyzed by UV-VIS.
2.2 Polymers / Electronics:
2.2.1 Soluble polymers:
(1) Weigh a sample.
(2) Add NMP, ultrasonic extraction.
(3) Alkaline digestion.
(4) Reaction with DCP.
(5) Make up with D.I. water.
(6) Analyzed by UV-VIS.
2.2.2 Insoluble/unknown polymers and electronics
(1)Weigh a sample.
(2) Add toluene and digestion solution.
(3) Heat sample in a microwave oven.
(4) Take aqueous phase for DCP reaction.
(5) Make up with D.I. water.
(6) Analyzed by UV-VIS.
3. PBBs/PBDEs
3.1 Weigh sample and add organic solvent.
3.2 By solvent extraction.
3.3 Concentrate the extract and make up with organic solvent.
3.4 Analyzed by GC-MS.
4. Phthalates:(DIBP, DBP, BBP, DEHP)
4.1 Sampling.
4.2 Weigh sample and add organic solvent.
4.3 By solvent extraction.
4.4 Analyzed by GC-MS.
5. Red phosphorus:
5.1 Sampling
5.2 Put sample into the sample cup
5.3 Analyzed by Pyrolyzer-GC-MS
6.REACH-SVHC
6.1 Sampling.
6.2 Sample pretreated by acid digestion, solvent extraction.
6.3 Analyzed by ICP-AES, UV-VIS, GC/MS, LC/MS, GC/FPD, LC/MS/DAD.
*2: If sample solution is significantly more intense than 0.13 μg/cm2 equivalent comparison standard, Chromium VI would be determined as detected, the result of visual observation is positive.
II. Measurement methods
1.Cd/Pb: IEC 62321-5:2013
2.Hg: IEC 62321-4:2013
3.Cr6+:
3.1 IEC 62321-7-1:2015 (boiling water extraction)
3.2 IEC 62321-7-2:2017 (solvent and alkaline extraction);
4.PBBs/PBDEs: IEC 62321-6:2015
5.Phthalates:(DIBP, DBP, BBP, DEHP): IEC 62321-8:2017
6.Red phosphorus: By Pyrolyzer-GC-MS analysis.
7.REACH-SVHC: Laboratory in-house method.
III.Environmental Logo

Environmental Concern & Keep Improving

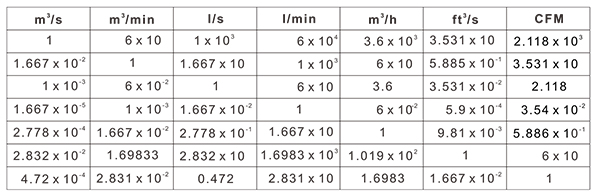
Major Equation & Parameter Conversion
I. Air Flow Rate
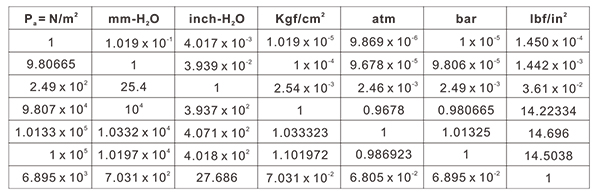
II. Static Pressure
III. System Allowable Temperature Rise

IV. Acoustic Noise
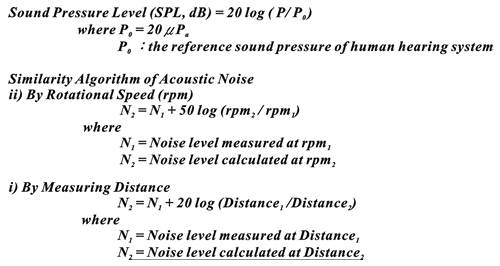
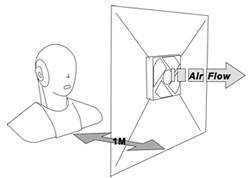
According to above equations, it is very clear the acoustic noise level will reduce 6 dB when the distance doubled. Comparatively, the noise level will also increase 6 dB when distance shorten by half.
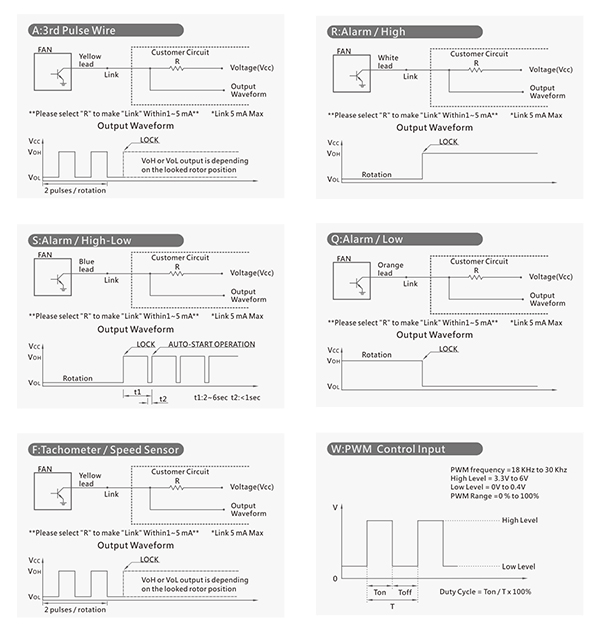
CWave Form of IC Function